Innovation management is about commercializing new products effectively. The product development and launch process should be managed closely to maximize the chances of success. This usually means that project management methods are used to develop project plans and detailed timelines. Many organizations use a phase-gate (or stage-gate) approach which helps to advance winning projects in the pipeline and hold off on projects with a lower potential value or probability of success. The decision points in the process are known as decision gates.
Value and risk
At each decision gate, decision makers compare the potential value (net present value of future sales or income) and the probability of successfully achieving that value for different projects. They allocate the available innovation resources to projects that offer the best value and the highest chance of success. Projects that are not funded are shelved for future reevaluation.
Therefore, at decision gates an objective measure is needed of the chance of success, as well as an indicator of project value. The value calculation is straightforward although highly uncertain. It requires making many assumptions about future market conditions, future technology, and customer behavior and preferences. Scenario analysis can help, but forecasts of future sales are still educated guesses.
Also, a lot of factors contribute to the probability of success (see Figure 1). Many of these are qualitative, so the probability of success is a semiquantitative rating at best, as it requires assigning numerical ratings to qualitative factors. A project with an 80% chance of success might still fail to commercialize 1 out of 5 times.
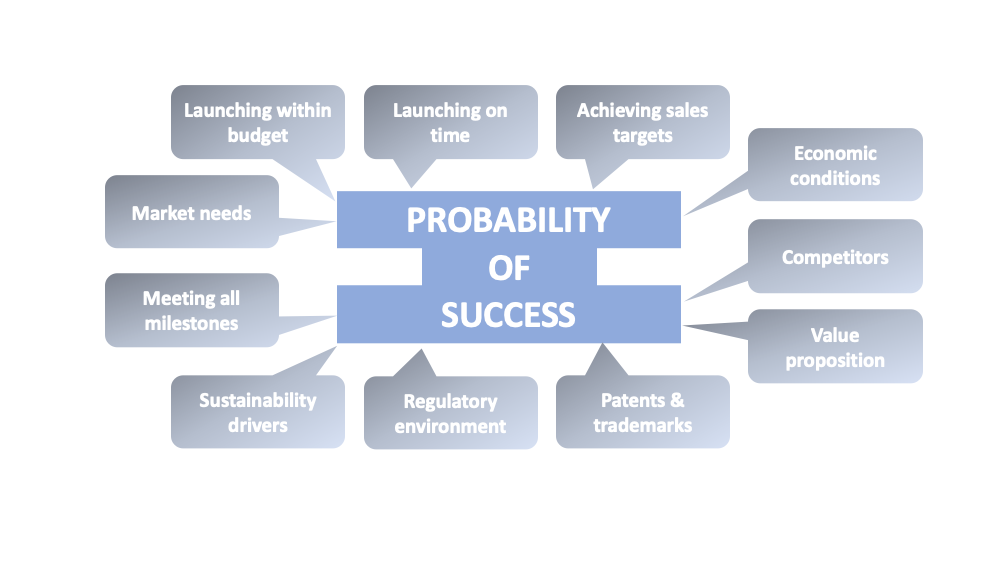
The probability of success is a snapshot of a more elaborate risk analysis. Every project encounters risks that need to be managed. There are many types of risk, from executional risk to market and technical risk. If the project team identifies risks at an early stage, it can plan risk mitigation to reduce their impact or likelihood of occurring. For example, to reduce the risk of a key product ingredient going out of stock, the project team could secure the supply ahead of time.
Operational metrics
Value and risk determine the ranking of each project in the portfolio at decision gates, but the project team should also present operational metrics. These are generally not included in either the value or risk calculation, but they influence the likelihood of commercialization of the project on time and within budget. First, the percentage of tasks in the current phase that have been completed determines how ready a project is to move to the next phase. This can only be measured if a project plan is in place that defines the tasks for each phase – which is not always the case, especially in organizations without a dedicated project management function.
A second operational metric is the project budget, both how much has been spent and how much is needed for the next phase. The gate decision team should not spend time on how much of the budget has been spent thus far. These past expenditures are “sunk costs” and should not be taken into consideration in the gate decision.
A third operational metric is launch timing. If a project is delayed, it has lost value because future revenues will also be delayed. Projects that have major delays may face different business conditions after launch than was assumed in the business case. In addition to lost sales, delays negatively affect the NPV, because launching sooner avoids changes in market trends and competitive conditions.
These are a lot of parameters to consider for the gate decision makers. Project teams often spend significant time preparing for gate meetings, because the data required may not be readily available in the correct format. Many organizations use PowerPoint templates for gate meetings and it takes significant time and effort to enter data and charts into these templates. Often, Excel sheets are used for project data and these need to be manually updated.
Project dashboards
In an earlier post we discussed digital tools that can make project tracking and data collection easier. A variety of software packages is available that facilitate project management and portfolio tracking. We recommend Smartsheet for phase-gate management, but other applications work just as well. Good alternative options are Sciforma and Planisware.
A feature of Smartsheet and other digital tools is the ability to design dashboards that present real-time data in an easy to review format. A gate review dashboard presents all the relevant data for a gate decision. With well-designed dashboards, stakeholders are able to view all important data about individual projects and about the project portfolio at any time. The data will be real-time and up to date. It’s hard to overstate what a game changer this capability is. The dashboards report real-time project-level data not based on archived databases, which makes them different from traditional business intelligence systems, which provide a big picture view of the whole organization.
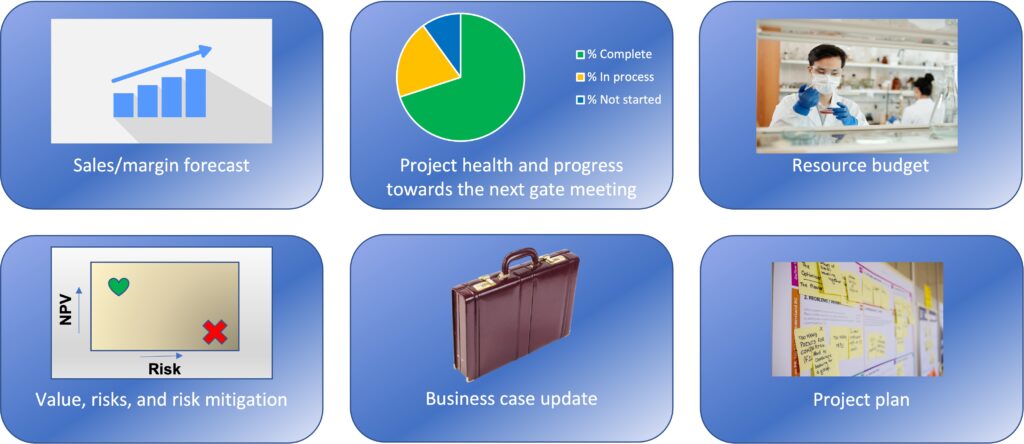
Project dashboards are immediately useful for gate meetings. Rather than filling out PowerPoint templates, project leaders can focus on making sure the project plan and project data are complete and up to date. A general dashboard design for decision gates is shown in Figure 2. It contains all the information needed for a well-grounded gate decision, from sales and margin forecasts, to project progress measures, budget information, project ranking against peers on value and risk metrics, project plan and timeline, and core business case data.
Dashboard construction
In practice, dashboards are based on data captured in project planning software. They need to be tailored to the organization, because different businesses have different data reporting needs at decision gates. Also, value calculations and risk management methods differ between firms because they have a different cost of capital (discount rate) and risk preference. However, in general all dashboards have a project completion component, a value and risk metric, and a resource usage metric, as illustrated above.
The best design for a dashboard depends on its intended audience. Would the dashboard be read only by decision makers, or also by project team members, or by members of the rest of the organization? Decision makers will want to see updated values for the project value and risk, together with an indication that the project plan is on track to reach the target launch date. For project team members, those metrics are important, but they also need to know overdue and upcoming project tasks that pertain to them. For the wider organization, project timing should be communicated as well as a view of how the project fits into the overall project portfolio.
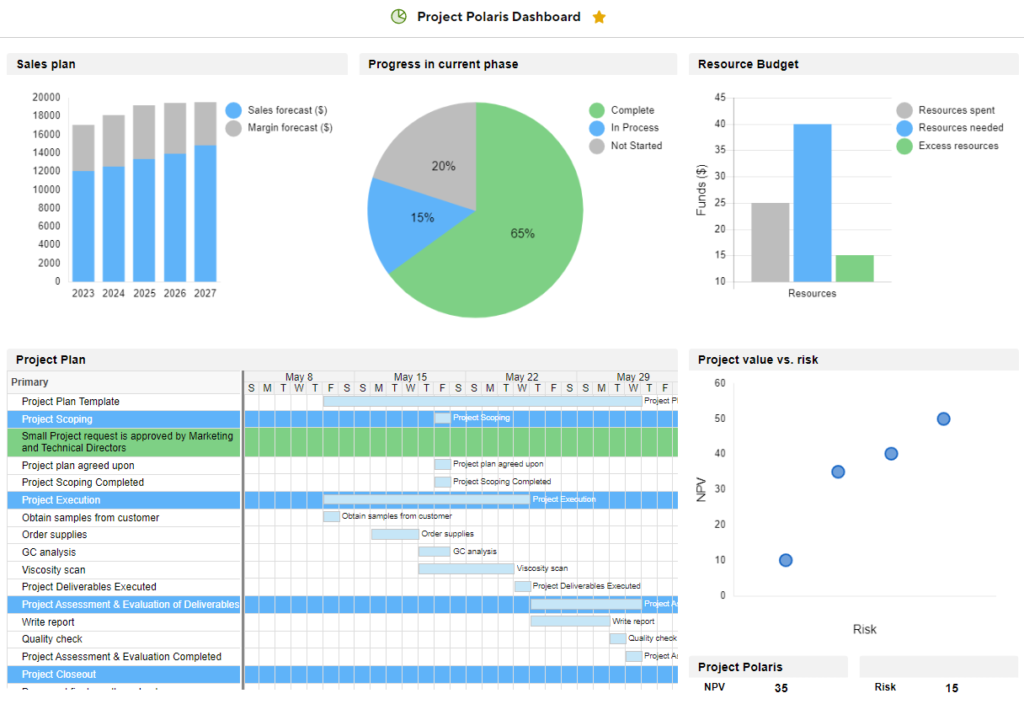
Figure 3 below shows an example of how the dashboard of a fictitious project could look in Smartsheet. The dashboard displays financial projections, progress on tasks in the current phase, the project budget, the project plan in Gantt chart view, and a chart of how the project’s risk and value compare to other projects in the innovation pipeline. Such a dashboard can be tailored to the organization’s preferences. In Smartsheet, it can link with other popular business intelligence software packages, such as Tableau, and CRMs such as Salesforce.
The power of these dashboards is that they always present an up to date, real-time view of projects and of the project portfolio. With project metrics that are always up to date, decision making is faster and better, leading to more efficient and productive allocation of resources to those projects that are on time, within budget, and have the best risk/reward ratio. Also, for customer projects, the organization is able to respond faster and more reliably to customer questions.
Next steps
Dashboards based on real-time data are useful in many businesses. If you would like to explore how we can make them work for your organization, please contact us to set up a free initial conversation.
Measured Innovation is a consulting firm with over 20 years experience developing and launching products in a stage-gate system.
This article was posted on LinkedIn on February 6, 2023.