
A large specialty chemicals company ran a sizeable portfolio of product development projects across its business units. Many of these projects had a high potential market value and a high probability of successful product launch. However, most did not have good project management, most were behind schedule, and senior management could not get an up to date overview of which projects were troubled and required extra attention. This situation caused a much lower return on R&D investment than could be expected.
Many organizations run innovation projects to develop and launch new products and processes. Such projects may be large, global initiatives with participants from multiple disciplines. They can also be very small, for example a single scientist working on a new concept. A firm often has many innovation projects. Effective project management is critical to assure timely completion of innovation projects within budget, while project portfolio management is needed to achieve a mix of projects with an optimum risk/value ratio.
There are several ways to measure the current risk and value of innovation projects. Often, such projects are managed with a stage-gate process with defined gate meetings at which the value and risk are assessed. A common valuation method is to calculate the net present value of a future product’s predicted cash flows. The probability of successful launch, which is a measure of project risk before launch, is often determined with a qualitative questionnaire. Another method is to do scenario analysis of different risky conditions and calculate the effect on the NPV, which measures the risks before and after launch.
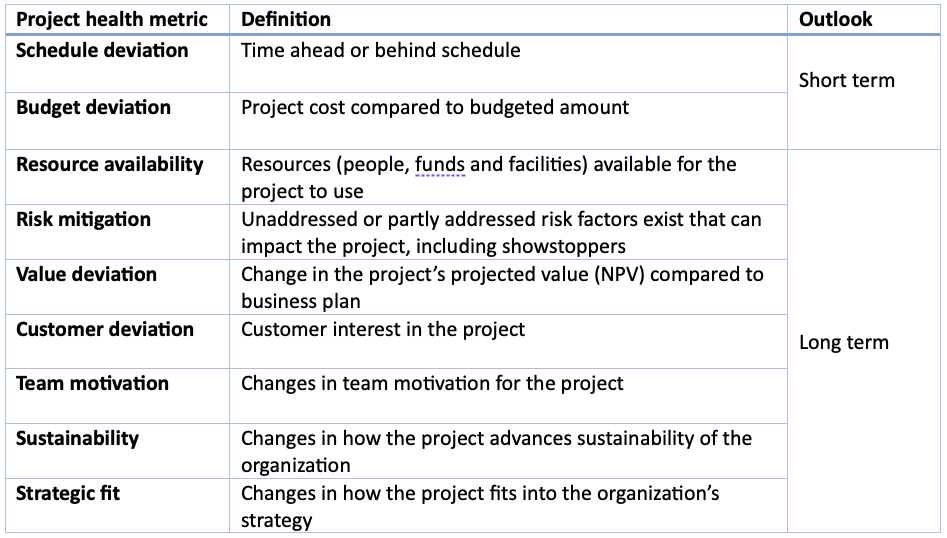
Outside of decision gates, managers often want a quick assessment of a project’s health. A project health indicator (PHI) shows whether a project is proceeding according to schedule and if it is within budget. There are other contributors to project health, for example resource availability, team composition and motivation, and customer feedback. A table of health metrics is shown below.
There is value in keeping the PHI as simple and easy to understand as possible. A metric based on the main features of projects may be best. Because project health is a short-term measure, the metric should be built on the project features that change in the short term. Long term health metrics such as team motivation and customer interest are better discussed at gate meetings. Those can be included in the probability of success questionnaire.
Various definitions of the PHI have been proposed. The Project Management Institute (PMI) has advanced a value-based method based on Earned Value Management. With that method, the PHI depends on the planned value of the work done to date, the earned value of the work to date, and the actual cost incurred to date. Whatever method is used, it’s important to make the measure as objective as possible, because project managers may want to report a project as doing better than the metrics show. Another metric used by the PMI is the return on innovation ratio, the ROI, defined as benefits – costs / costs.
Table: Project Health Metrics
A PHI based on the schedule deviation and budget deviation might take the form of a weighted average of numerical ratings for each of these attributes. For some projects, launching on schedule may be all important. For others, cost control may be paramount. The weights and rating scales can differ from project to project, but the end result for the PHI should be a number that indicates whether the project needs management attention, is close to failure, or is on track. This can be visualized in a traffic light image or similar graphic.
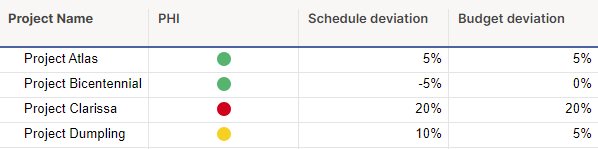
Project portfolio management software such as Smartsheet can be used to create dashboards with PHI numbers for every project updated in real time. This gives senior management the ability to monitor the project portfolio and quickly see where their attention should be directed. Projects that are delayed or over budget will be highlighted. Resources can be directed to those projects to get them back on track. For seriously troubled projects, unless a fast pathway to success exists, work can be halted, freeing up workers and funding for other projects.
In product development for the consumer products and specialty chemicals industries, generally personnel costs are the main cost driver. These costs scale with project duration. If a project is delayed, personnel costs increase, as do the costs associated with a delayed product launch. In this situation the PHI is mainly driven by schedule deviations. Maintaining a healthy PHI by effective project management is critical for a good return on innovation investment and for efficient resource management.
The ideal final state of the project portfolio after setting up PHIs is a portfolio dashboard as shown. The dashboard makes it clear which projects are on track and which need attention. Projects with poor health should be critically evaluated to confirm that they can be brought back on track and that resources are not better spent on other projects and concepts. On the other hand, if the entire portfolio is healthy, it might be possible to fund more projects with the same R&D headcount and set project deadlines more aggressively.
In summary, developing an easy to understand project health indicator promotes effective people management and resource utilization. A prerequisite for a meaningful PHI is that a detailed project plan with timeline is set up and regularly updated. Also, project expenditures should be tracked against the project budget.